挫折系タイトルです←
IoTっぽくリアルタイムに送信されていくるデータを、Web上で可視化することは出来ないかと思い、少し調べてみましたが...。
ひとまず、こんなJavaScriptライブラリが見つかりましたので、紹介します。
Epoch.js : http://epochjs.github.io/epoch/
D3.jsベースの、リアルタイムにデータを可視化するためのライブラリのようです。
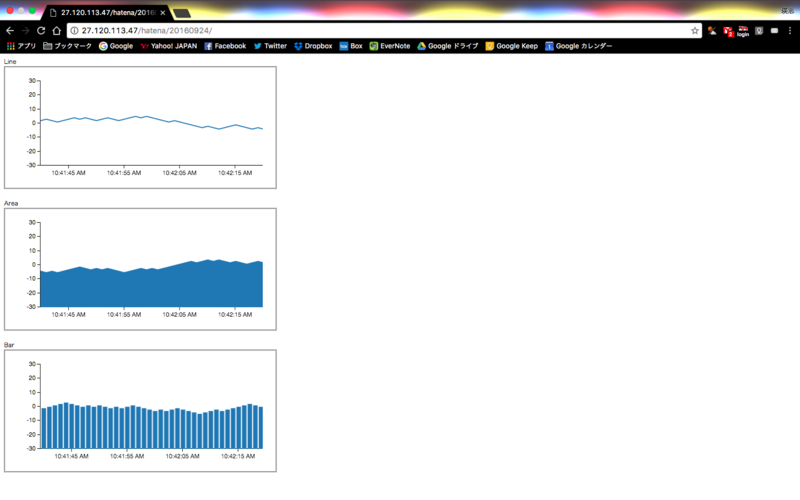
実際に少し使ってみました。
※画像をクリックするとページを移動します。
function init(){
  var line = new _line();
  line.draw();
  var area = new _area();
  area.draw();
  var bar = new _bar();
  bar.draw();
}

function _line(){
  this.targetId = "line";
  this.target = $("#" + this.targetId);
  this.width = this.target.parent().width();
  this.height = this.target.parent().height();
  this.time;
  this.data;
  this.type = "time.line";
  this.axes = ["left", "bottom"];
  this.ticks = {"time": 10};
  this.range = [-30, 30];
  this.val;
  this.nextData;
  this.update;
  this.timeout;
}

_line.prototype.draw = function(){
  this.time = (new Date()).getTime()/1000;
  this.val = 0;
  this.data = [{label: "layer 1", values: [{time: this.time, y: this.val}], range: this.range}];
  this.target = this.target.addClass("epoch my-colors")
    .css("width", this.width + "px")
    .css("height", this.height + "px")
    .epoch({
      type: this.type,
      data: this.data,
      axes: this.axes,
      ticks: this.ticks,
      range:{left: this.range},
    });
  var that = this;
  this.update = function(){
    that.time = (new Date()).getTime()/1000;
    if(that.val == 30){
      that.val -= 1;
    }else if(that.val == -30){
      that.val += 1;
    }else{
      var r = Math.random();
      if(r <= 0.5){
        that.val += 1;
      }else{
        that.val -= 1;
      }
    }
    that.nextData = [{time: that.time, y: that.val}];
    that.target.push(that.nextData);
    that.timeout = setTimeout(function(){
      that.update();
    }, 1000);
  }
  this.update();
}

function _area(){
  this.targetId = "area";
  this.target = $("#" + this.targetId);
  this.width = this.target.parent().width();
  this.height = this.target.parent().height();
  this.time;
  this.data;
  this.type = "time.area";
  this.axes = ["left", "bottom"];
  this.ticks = {"time": 10};
  this.range = [-30, 30];
  this.val;
  this.nextData;
  this.update;
  this.timeout;
}

_area.prototype.draw = function(){
  this.time = (new Date()).getTime()/1000;
  this.val = 0;
  this.data = [{label: "layer 1", values: [{time: this.time, y: this.val}], range: this.range}];
  this.target = this.target.addClass("epoch my-colors")
    .css("width", this.width + "px")
    .css("height", this.height + "px")
    .epoch({
      type: this.type,
      data: this.data,
      axes: this.axes,
      ticks: this.ticks,
      range:{left: this.range},
    });
  var that = this;
  this.update = function(){
    that.time = (new Date()).getTime()/1000;
    if(that.val == 30){
      that.val -= 1;
    }else if(that.val == -30){
      that.val += 1;
    }else{
      var r = Math.random();
      if(r <= 0.5){
        that.val += 1;
      }else{
        that.val -= 1;
      }
    }
    that.nextData = [{time: that.time, y: that.val}];
    that.target.push(that.nextData);
    that.timeout = setTimeout(function(){
      that.update();
    }, 1000);
  }
  this.update();
}

function _bar(){
  this.targetId = "bar";
  this.target = $("#" + this.targetId);
  this.width = this.target.parent().width();
  this.height = this.target.parent().height();
  this.time;
  this.data;
  this.type = "time.bar";
  this.axes = ["left", "bottom"];
  this.ticks = {"time": 10};
  this.range = [-30, 30];
  this.val;
  this.nextData;
  this.update;
  this.timeout;
}

_bar.prototype.draw = function(){
  this.time = (new Date()).getTime()/1000;
  this.val = 0;
  this.data = [{label: "layer 1", values: [{time: this.time, y: this.val}], range: this.range}];
  this.target = this.target.addClass("epoch my-colors")
    .css("width", this.width + "px")
    .css("height", this.height + "px")
    .epoch({
      type: this.type,
      data: this.data,
      axes: this.axes,
      ticks: this.ticks,
      range:{left: this.range},
    });
  var that = this;
  this.update = function(){
    that.time = (new Date()).getTime()/1000;
    if(that.val == 30){
      that.val -= 1;
    }else if(that.val == -30){
      that.val += 1;
    }else{
      var r = Math.random();
      if(r <= 0.5){
        that.val += 1;
      }else{
        that.val -= 1;
      }
    }
    that.nextData = [{time: that.time, y: that.val}];
    that.target.push(that.nextData);
    that.timeout = setTimeout(function(){
      that.update();
    }, 1000);
  }
  this.update();
}
ただし、ソースを見れば分かりますように、データはクライアント側(JavaScript)で適当に生成しているだけですので、これじゃただのアニメーション可視化と変わらないです。
これをサーバー側でデータを生成し続けて、それを通信取得しにいくとなると、従来であれば全件リロードになってしまいます。
それをリアルタイムに通信して可視化を更新していけるような作りにしたかったのですが、今はまだ手軽に出来るものではないのかもしれませんね...。
恐らく可視化云々よりも、通信技術の問題になりそうです。
それが可能になれば、普通のD3.jsのアニメーションでも色々と遊べそうな気はします。
引き続き、調査が必要ぽいです。
コメント